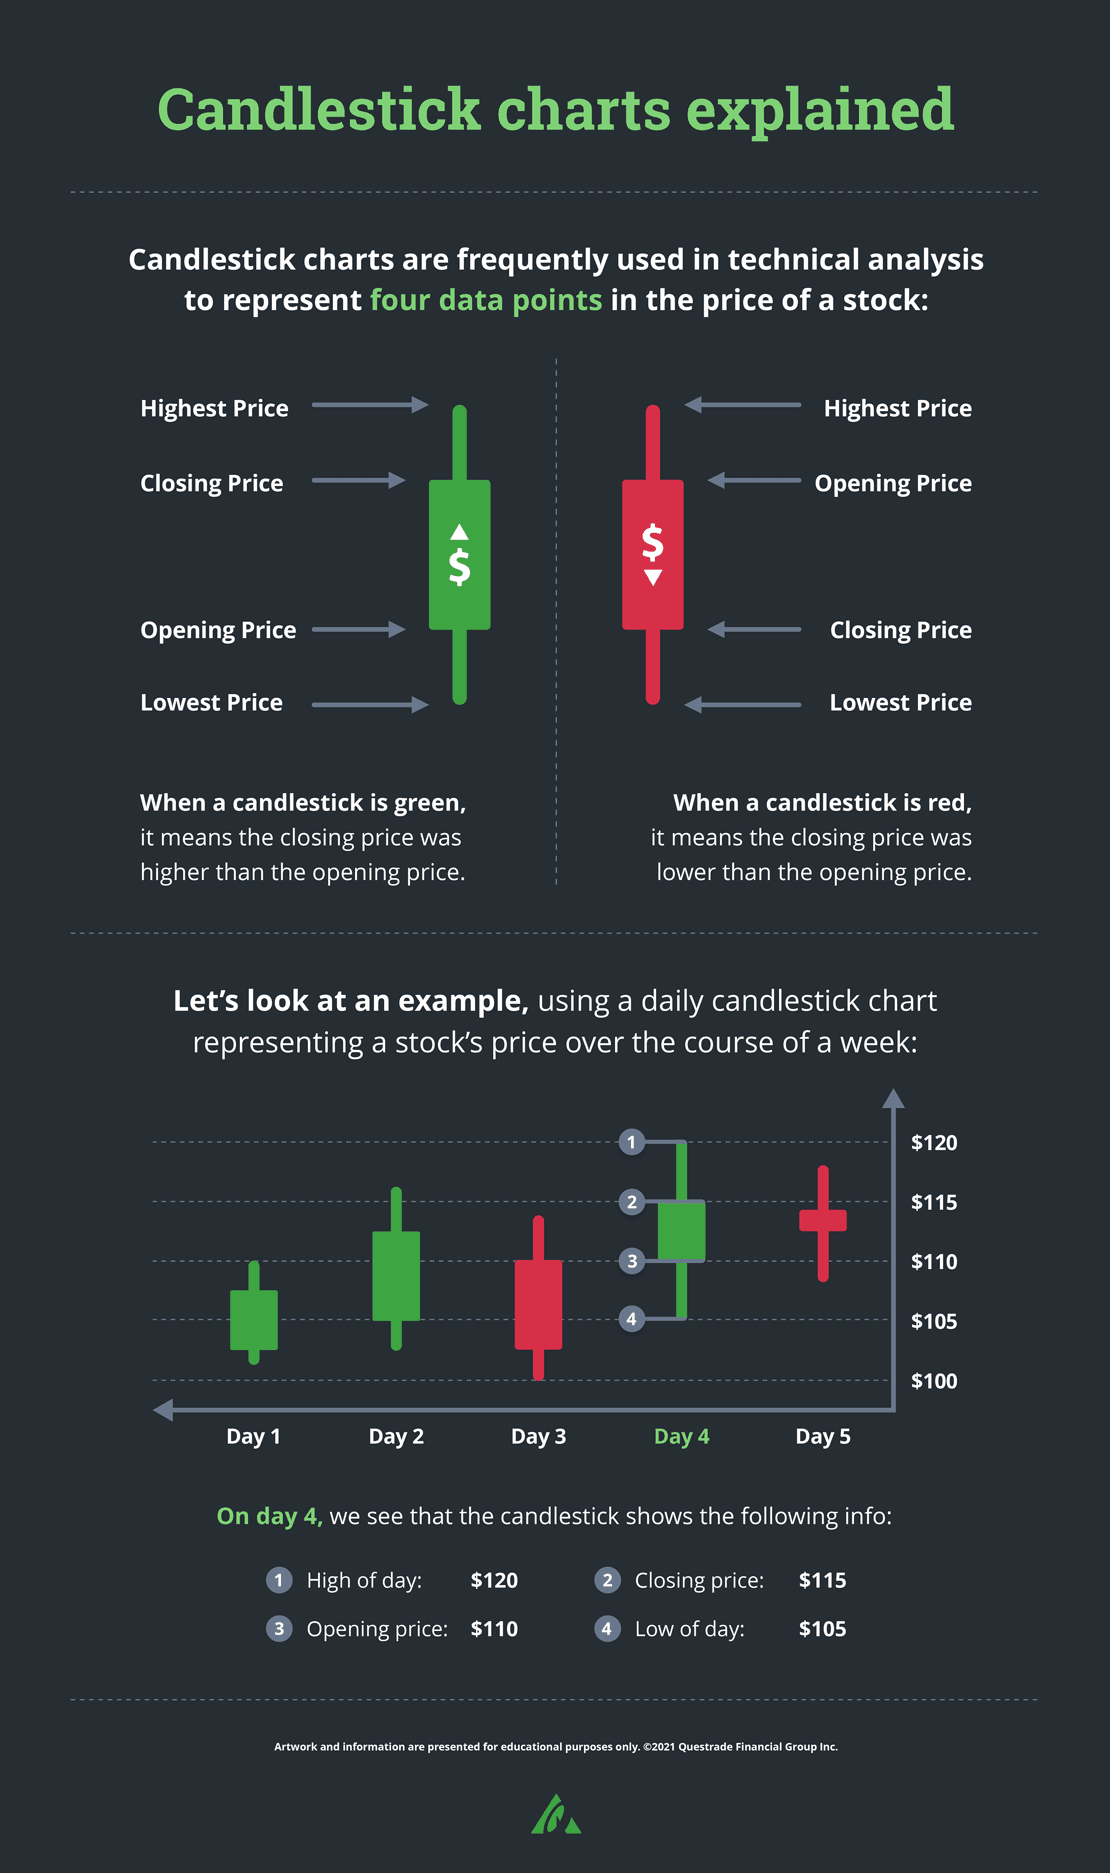
Candlestick charts explained (Infographic)
1 min read
Published: Dec 13, 2021
Updated: Apr 04, 2022
Learn what data points candlestick charts represent, and how to read them.
New customers get up to $500 to open and fund their first self-directed account using code GET500. Ends July 23. See details.
(opens in a new tab)Published: Dec 13, 2021
Updated: Apr 04, 2022